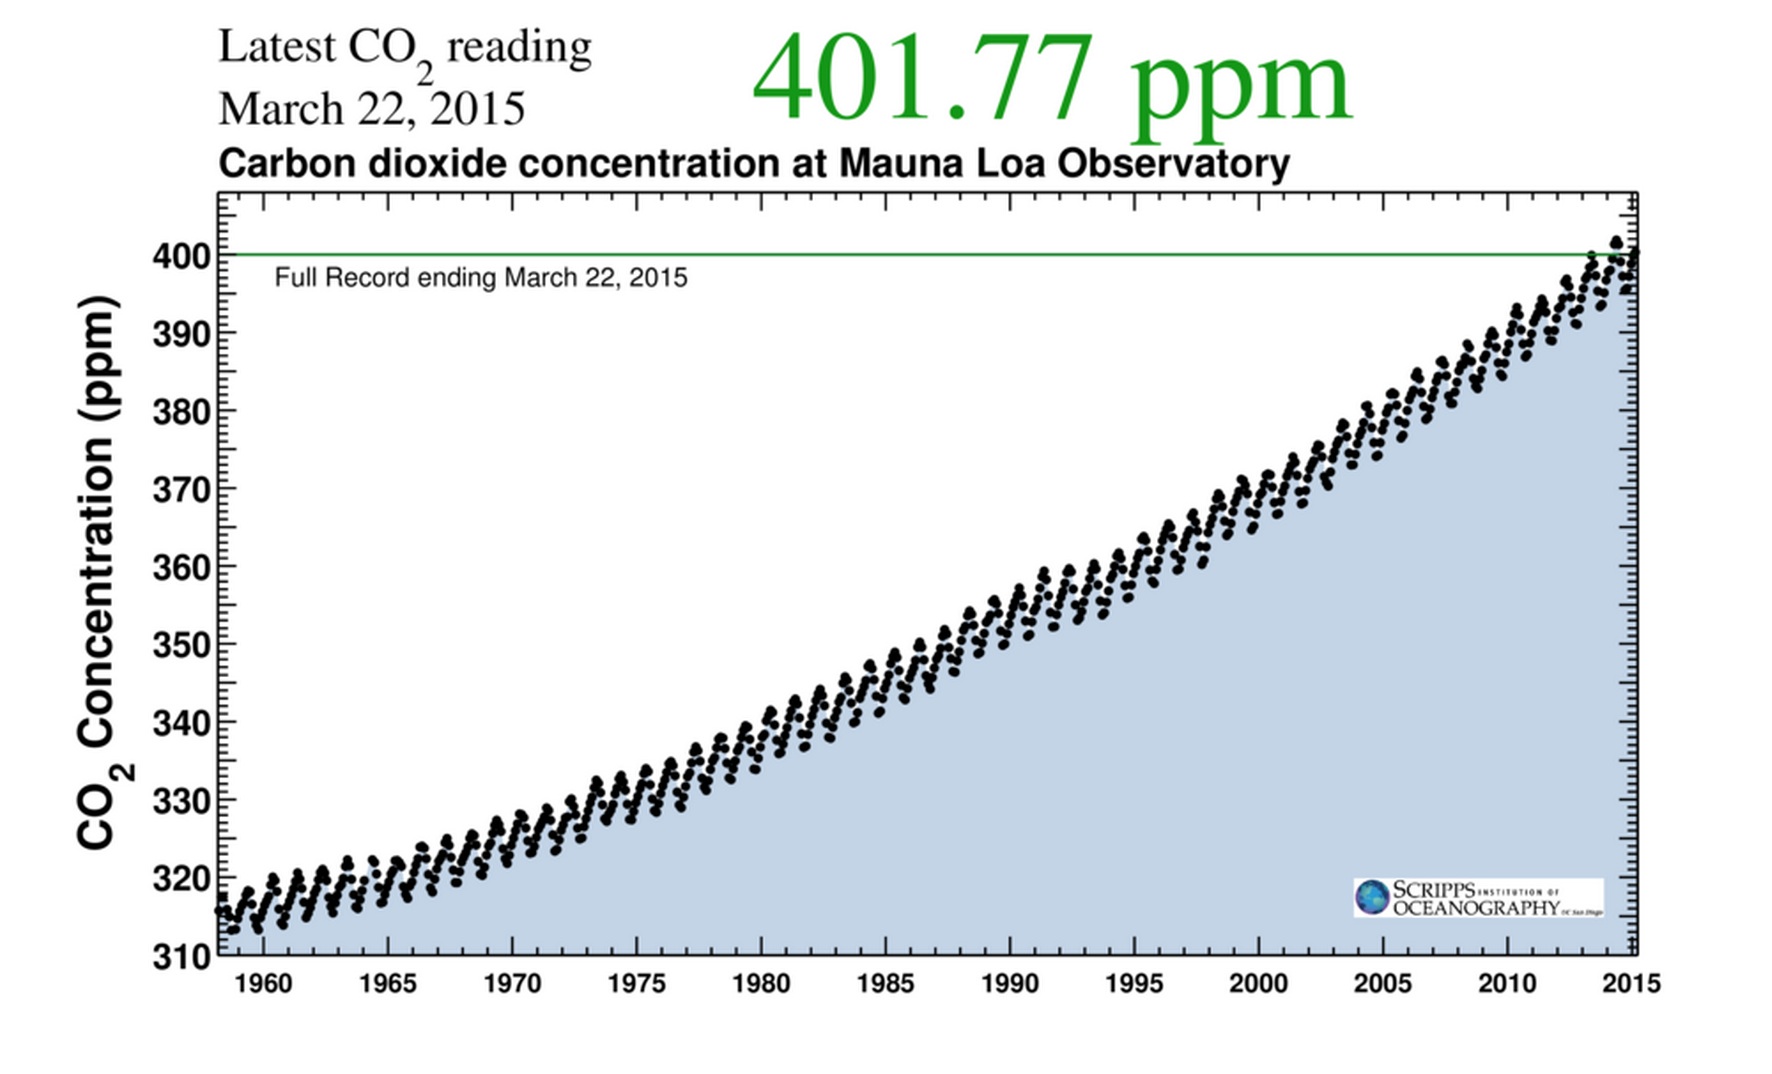
 The Keeling Curve—the sawtoothed upward slope of atmospheric carbon-dioxide concentrations—may be the world’s most famous scatter plot. The data that form the curve have been accumulating since the 1950s, when scientist Charles David Keeling set up his instruments at a geophysical observatory high on Mauna Loa, one of the massive volcanoes that form the Big Island of Hawai’i. Keeling soon discovered that the level of carbon-dioxide in the atmosphere fluctuates seasonally, but by the late 1960s, his precise measurements had revealed another story: the average concentration of carbon dioxide was increasing. Through chemical tests, Keeling and his colleagues established that the increase was due to the combustion of fossil fuels, and the Keeling Curve became a fundamental piece of evidence in the case for the reality of climate change. Keeling died in 2005, but his son Ralph has continued his father’s work on Mauna Loa, and their eponymous curve continues to illustrate both the steady respiration of the planet and the basic fact of climate change.
The Keeling Curve is now an iconic data image, reproduced on a brass plaque at Mauna Loa and in the lobby of the National Academies Building in Washington, D.C., where it is displayed next to illustrations of Darwin’s finches and the structure of DNA. But the curve is also a piece of history, and for the past few years, historian Joshua Howe has been considering the curve and humanity’s place on it. In his book Behind the Curve, and in a new article in Environmental History, he looks at the curve as a historical record—and as a metaphor for the relationship between science and society.
Howe traces the political history of climate change through the Cold War, Vietnam, and the advent of the environmental movement into the 21st century. The curve itself bears political scars, he notes: in the spring of 1964, a three-month gap in funding left a permanent break in the curve. Yet on the whole, public knowledge of and concern about climate change is far higher in 2015 than it was in 1958. Our understanding has, so to speak, followed the curve.
Why, then, is the Keeling Curve still rising—and getting steeper?
The easy answer, Howe told me recently, is that rich and powerful interests have blocked proposed controls on carbon-dioxide emissions. But he also blames scientists’ and activists’ outsized faith in what a congressional science adviser in the 1970s described as the “forcing function of knowledge”—the ability of more data, more points on the curve, to drive change from the top down. The repeated failure of knowledge to force change is a tragedy, he says—not only in the sense that the effects of climate change are already causing human suffering, but also in the sense that scientists and activists have been aiming at, and missing, the same target for decades.
I’ve argued elsewhere that we should treat climate change less like a tragedy and more like a comedy—not because there’s anything funny about climate change, but because in tragedies we know the ending and in comedies we do not. In a tragedy, the hero follows a more or less straight, Keeling-like trajectory toward her own or others’ destruction; in a comedy, the characters are often just shy of disaster, reeling this way and that as the audience guesses at their fate. The “comic frame,” the literary theorist Kenneth Burke wrote in the 1930s, views “human antics as a comedy, albeit as a comedy ever on the verge of the most disastrous tragedy.”
Howe points to the many U.S. states and cities that have devised climate action plans in the the absence of federal action on climate change, and suggests that while these are not enough to head off the worst effects of climate change, they can make a difference, both by directly reducing the levels of carbon-dioxide in the atmosphere and by setting examples for others, in the U.S. and abroad, to follow. These measures are not grand, heroic gestures; they’re bureaucratic, technical, even boring. But it may be in these small steps—in this comedic, unscripted dance with the possible—that we finally find a path away from the tragic cliff, and a way to bend the Keeling curve.
The latest Keeling Curve is available here.
Nice piece, Michelle. Thanks. I like the comedy aspect. I like the hashtag #climatehope. And I like seeing the trees budding out this time of year, sucking up CO2, and causing those little dips in the Keeling Curve. I only wish the dips were deeper, wishing the entire curve would flatten, wishing we could see CO2. But it’s going to take more work, more stories and images, more science and song. Which is why I decided to write a kids book on climate change, “PLEASE DON’T PAINT OUR PLANET PINK!” It contains humor, watercolor illustration, and a little science. We need kids engaged. It’s their future, impacted by my generation’s excesses and emissions.
Pity, the most interesting fact is that the graph reveals nothing about an anthropogenic cause, or for that matter any other cause. Data will not save us. This is significant.
A great post. Thanks for writing. The ever-excellent BBC History podcast “Witness” ran an episode on the Keeling Curve a few months ago. It includes interviews and discussion with Charles Keeling’s widow, Louise and son, Ralph.
You can listen here and download on iTunes: http://www.bbc.co.uk/programmes/p012jcxd