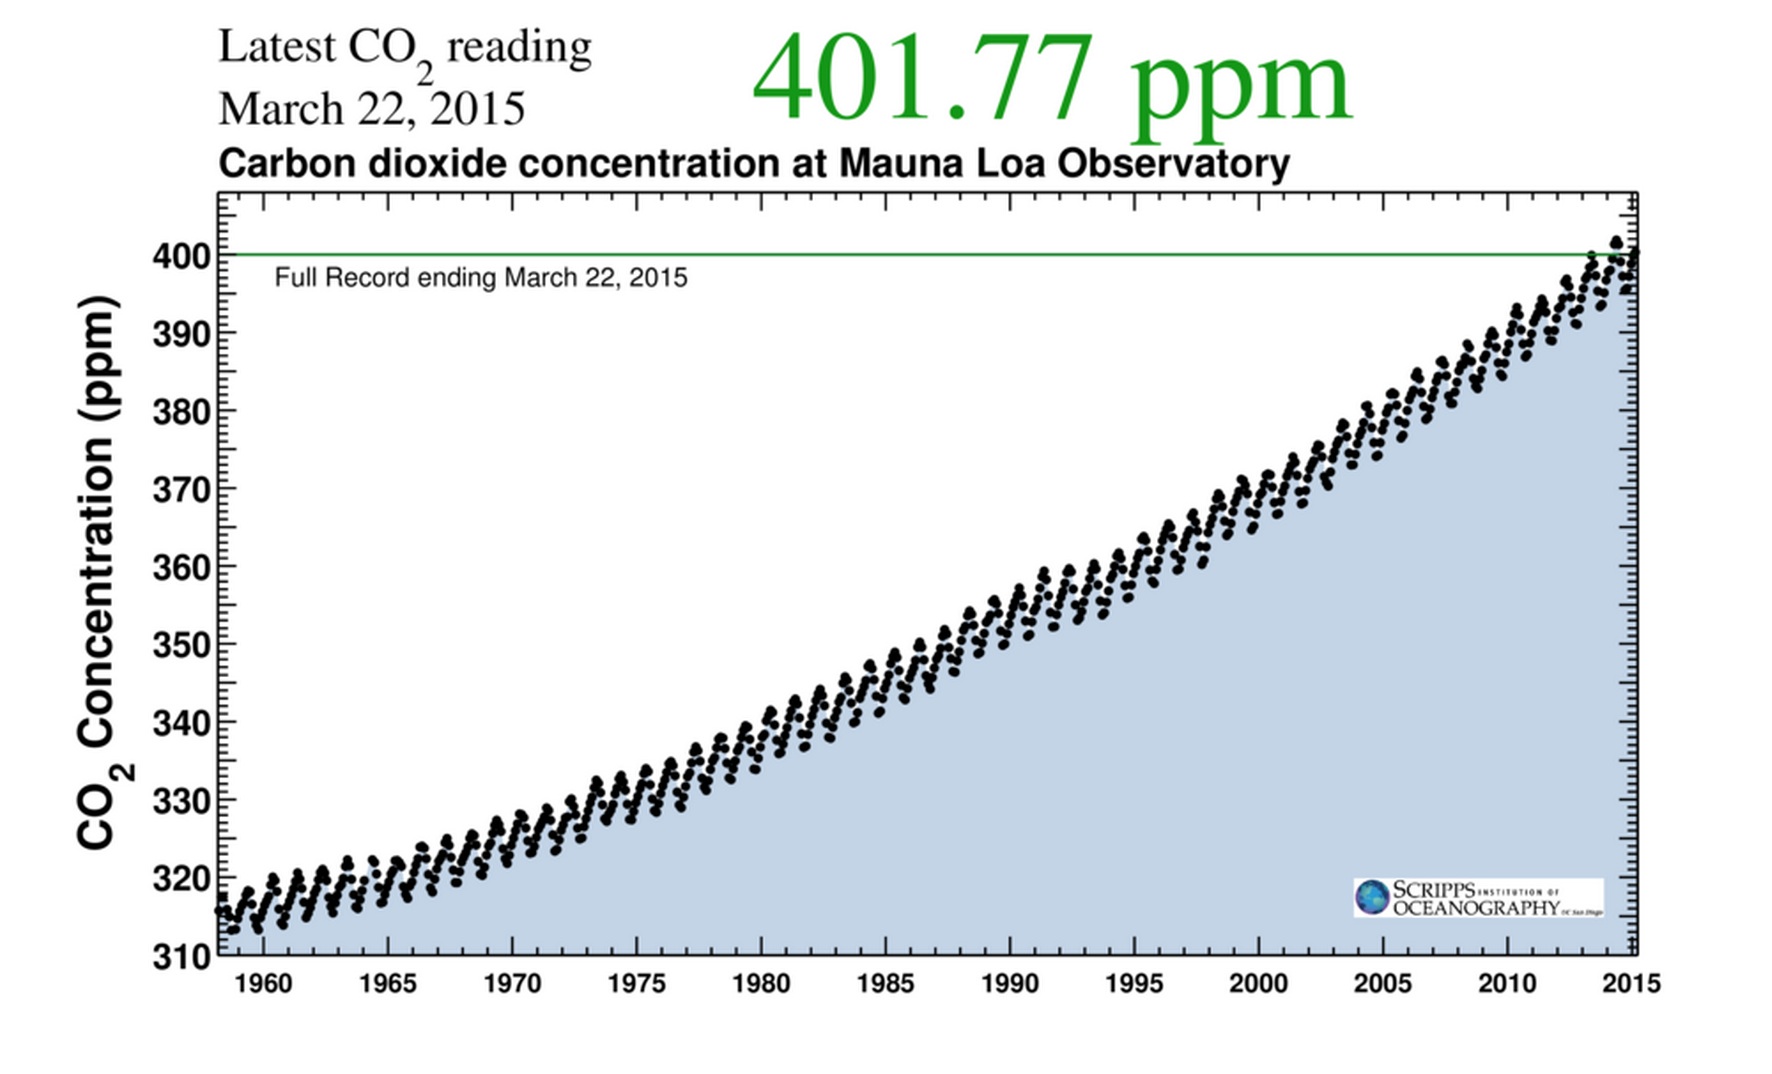
 The Keeling Curve—the sawtoothed upward slope of atmospheric carbon-dioxide concentrations—may be the world’s most famous scatter plot. The data that form the curve have been accumulating since the 1950s, when scientist Charles David Keeling set up his instruments at a geophysical observatory high on Mauna Loa, one of the massive volcanoes that form the Big Island of Hawai’i. Keeling soon discovered that the level of carbon-dioxide in the atmosphere fluctuates seasonally, but by the late 1960s, his precise measurements had revealed another story: the average concentration of carbon dioxide was increasing. Through chemical tests, Keeling and his colleagues established that the increase was due to the combustion of fossil fuels, and the Keeling Curve became a fundamental piece of evidence in the case for the reality of climate change. Keeling died in 2005, but his son Ralph has continued his father’s work on Mauna Loa, and their eponymous curve continues to illustrate both the steady respiration of the planet and the basic fact of climate change.
The Keeling Curve is now an iconic data image, reproduced on a brass plaque at Mauna Loa and in the lobby of the National Academies Building in Washington, D.C., where it is displayed next to illustrations of Darwin’s finches and the structure of DNA. But the curve is also a piece of history, and for the past few years, historian Joshua Howe has been considering the curve and humanity’s place on it. In his book Behind the Curve, and in a new article in Environmental History, he looks at the curve as a historical record—and as a metaphor for the relationship between science and society.