Data mining. Maybe the term makes you think of tapping out facts out with a pickax, or of scary algorithms and programming. But it doesn’t have to be that way. With this handy guide, I’ll show you how to do (rudimentary) data mining from the comfort of your desk, no computer science degree necessary. All you’ll need is a computer with an Internet connection, a spreadsheet, and a lot of time. Optional but highly recommended: music and beer. You’ll want a lot of the latter.
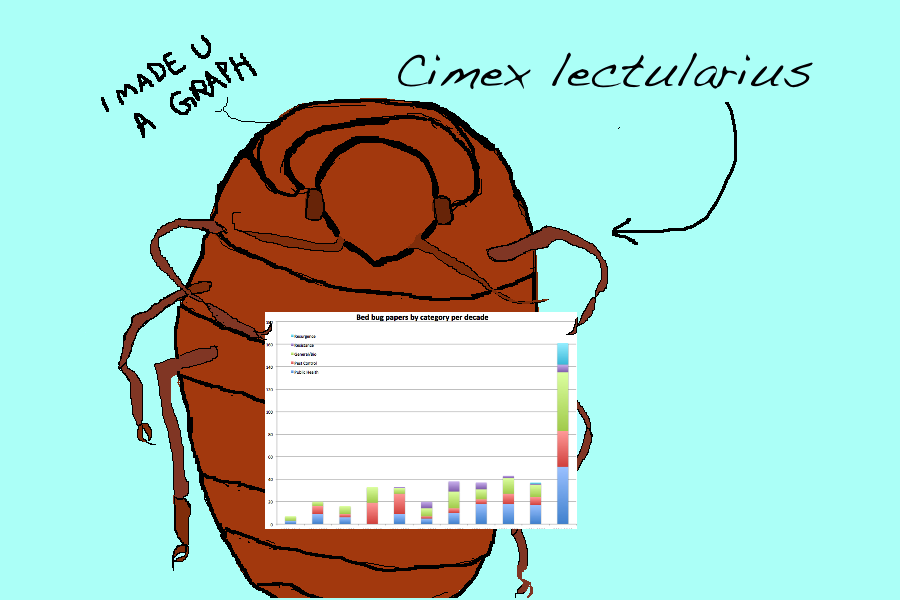
We’ll use my own data mining project as an example, in which I was trying to look at trends in bed bug research since the early 1900s. Uh, why, you ask? I’ve been working on a book about bed bugs for two years, and I was trying to answer a question. During my research, nearly every bed bug expert has told me that when bed bug populations dropped drastically after World War II and the advent of DDT, at least in some parts of the world, research on bed bugs similarly dropped for many decades. Then, when it was evident to scientists that the bed bugs were resurging in the early aughts, they had to relearn how to raise the bugs in the lab and how to study them.
This is partly true. But, during my research, I kept coming across bed bug journal articles from the seventies and eighties. My question was, if no one was studying bed bugs, why were they publishing studies about them? I decided to map out all of the journal articles I could find and see if the trend matched the story.
Now, I realize that after you read this, you may conclude that I’m nuts or obsessive (or both!). And that’s fine, because all evidence points to the affirmative.
Anyway. Here’s what I did.
Step 1: Find the data: Before you can mine, you need to find the data. I decided that published journal articles about bed bugs research was a good indicator that the research existed. So, I made a list of scientific literature databases that reasonably covered the major studies over the past century or so: PubMed, Wiley, SciDirect, Springer, Taylor & Francis, PLOS ONE, JSTOR, and a private list from a USDA entomologist.
Step 2: Create search terms: Next, you need to pull out the relevant information. To find bed bug articles, I picked the two most common spellings for bed bugs, added both singular and plural just in case that might help, and added on the Latin name of the specific species I was looking for. My string of terms looked like this: (“bed bug” OR bedbug OR “bed bugs” OR bedbugs OR “cimex lectularius”). Then, I searched all the databases for that (except for the USDA database, which already only covered bed bugs).
Step 3: Export: You need a place to put your data, which will let you play around with it and maybe graph it. You’ll want some sort of spreadsheet for this. I used Excel. Yeah yeah, there are probably hipper options out there, but I had it already and I knew how to manipulate data and make graphs with it. I exported the results from each database to a .csv file, when possible, because Excel likes .csv. Some databases wouldn’t export to .csv files. This made me sad, until I discovered JabRef, which allowed me to export other file types and then convert to .csv. Still other databases had no export function, which meant I had to copy and paste the entries into Excel. This made me sad until I discovered Step 4.
Step 4: Beer and Music: This probably should be the first step. But, if you lasted this long without a beer and something nice to listen to, you’ll definitely want to fix that for the remaining steps. In case you’re wondering, it’s okay to continue this step through to the end. In fact, I insist on it.
Step 5: Clean up: Some databases overlap, and you don’t want double entries. I sorted my Excel sheet by article name and citation to find and delete these. I also cleaned out any articles that clearly weren’t actually about bed bugs, or about the species of bed bug I was interested in (there are around 100 species of bed bugs. Yowza).
Step 6: Organize: A giant database of names isn’t helpful if you can’t see what’s there. I started out wanting to see trends over time, but by this step I decided it’d also be helpful to look at the focus of the research and where it was happening. So, I color-coded the publications into five broad categories (General/Biology, Pest Control, Public Health, Pesticide Resistance, Resurgence) and added a spreadsheet column showing which world region they came from. (Yes, I color-coded my bed bug journal article database. Yes, you can laugh).
Step 7: Graph: Now for the fun part. There are many ways to graph data; I decided on stacked columns so I could see the distribution of research type or region of publication per year. I’ll leave out the specifics, because it is boring, but I essentially tallied up the number of publications for each year and related category, entered them on a fresh spreadsheet, and created the graphs based on those. Here are a few examples:
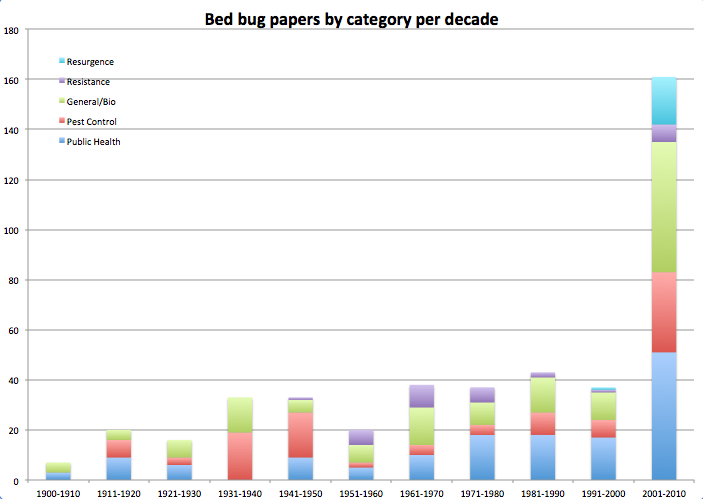
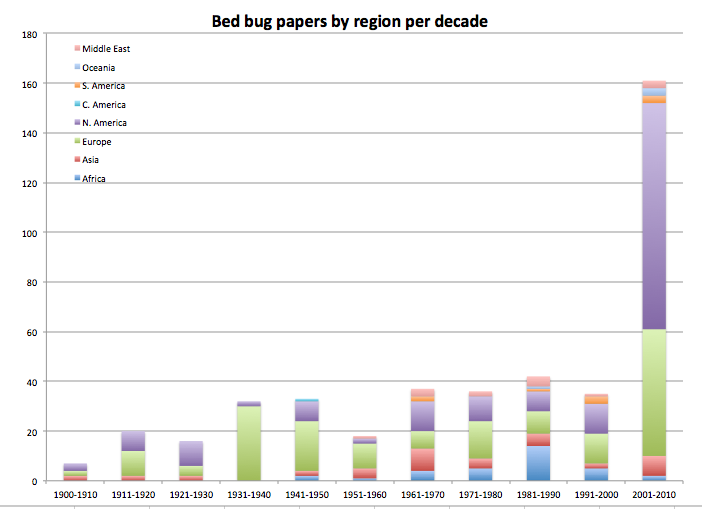
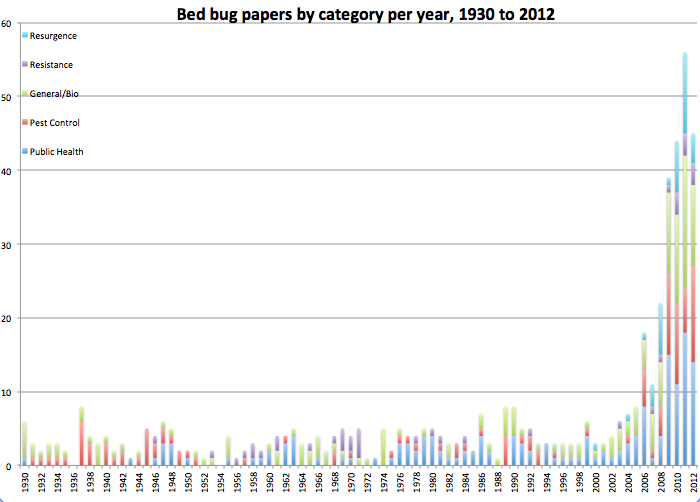
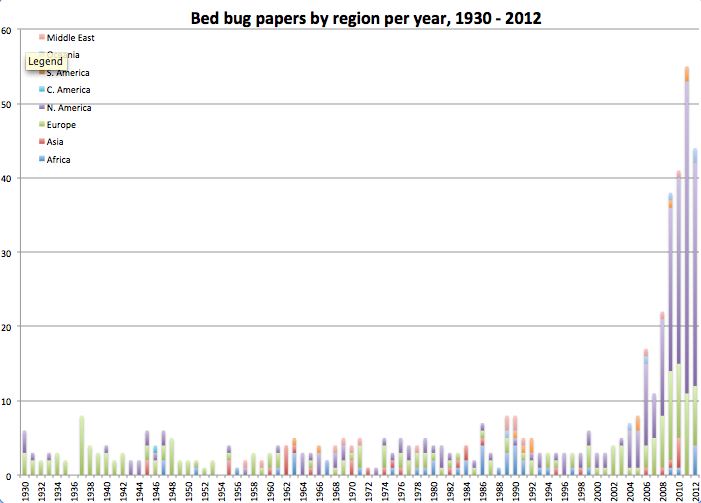
My database is by no means exhaustive or perfect. The results could be influenced by external factors like publishing trends, as is noted in these posts and their comments on a related topic, or by how I decided to categorize the data, or whether the source databases represent the reality of what was actually published, especially for older studies. But, it is clear that the tidy story claiming no bed bug research followed WWII isn’t quite right. Bed bugs weren’t a wildly popular topic, but people still studied them a little bit. The other data organization also paid off, because the graphs visualize when papers on pesticide resistance snuck in (after DDT had been around for a few years), who was doing research when, and how the number of publications jump dramatically after the bed bug resurgence.
I’m curious, LWON readers, whether you’ve ever worked with data this way. If so, how did you do it, and did it help answer your question? And, what flaws do you see in my experiment?
**
Brooke Borel is a science writer in Brooklyn, New York. She is currently writing a book about bed bugs for the University of Chicago Press (2014). Find more of her work at www.brookeborel.com or follow her on Twitter @brookeborel.
Image credits: Brooke Borel
No, I’ve never done it. And I’m too impressed to see any flaws.
You might want to scale the number of papers by the total number of papers you searched.
Pretty cool though
Wow Brooke. All I can say is, if you’re putting this much reporting into addressing just this one question, I can’t wait to read your whole book!
Erika, this particular question was fairly central to a main storyline for the book, so I wanted to make sure I got it right. But, I am definitely researching other aspects to (possibly crazy) levels as well. Stay tuned!
Mike the Mad Biologist: I tried doing this with a subset of data, using the total number of papers per year. It reversed the trend after WWII, but it also made the most recent papers over the last decade seem negligible, and I wonder if the exponential influx of new journals covering increasingly nuanced subject matter– many of which would never cover bed bug research– is skewing the results. It seems like I should just use a subset for the “total number of papers” within the journals that actually cover something like bed bugs, but I don’t see any way to pull this data out.
What do you think?
Another cool way to quickly organize data is an open-source tool called KNIME. (knime.org) I wouldn’t recommend it for making your graphs, but for organizing/joining/manipulating the data and then exporting to csv, it’s great. It can be used to carry out SQL type functions in a nice GUI interface. And you can look at your data every step of the way!
One thing you could do is scale bedbugs to other terms, and see how that compares (Drosophila might be a good one).
I came across your post from Per Square Mile and as I looked over your graphs I noticed some other trends. Why the years with few or no articles published? I was doing background research on a former student for a recommendation and found out that the sequester is pulling most of the funding for the research. Could the dips be the result of funding being cut or recessions? Though that doesn’t explain the last few years.
Mike, interesting thought. Maybe I’ll try that when I find the time
Paul, it’s certainly possible, although I haven’t looked into potential funding influences on the data.